The Hidden Danger of Safety Metrics
Are You Measuring the Wrong Things?
If your safety report shows zero injuries, does that mean your workplace is safe?
That question should make your stomach tighten. Because the real answer—the honest answer—is: Not necessarily.
For decades, safety leaders have worked tirelessly to reduce injury rates and improve compliance. But in the race to lower numbers like TRIR (Total Recordable Incident Rate), DART (Days Away, Restricted or Transferred), and LTIR (Lost Time Injury Rate), many organizations have created a dangerous illusion:
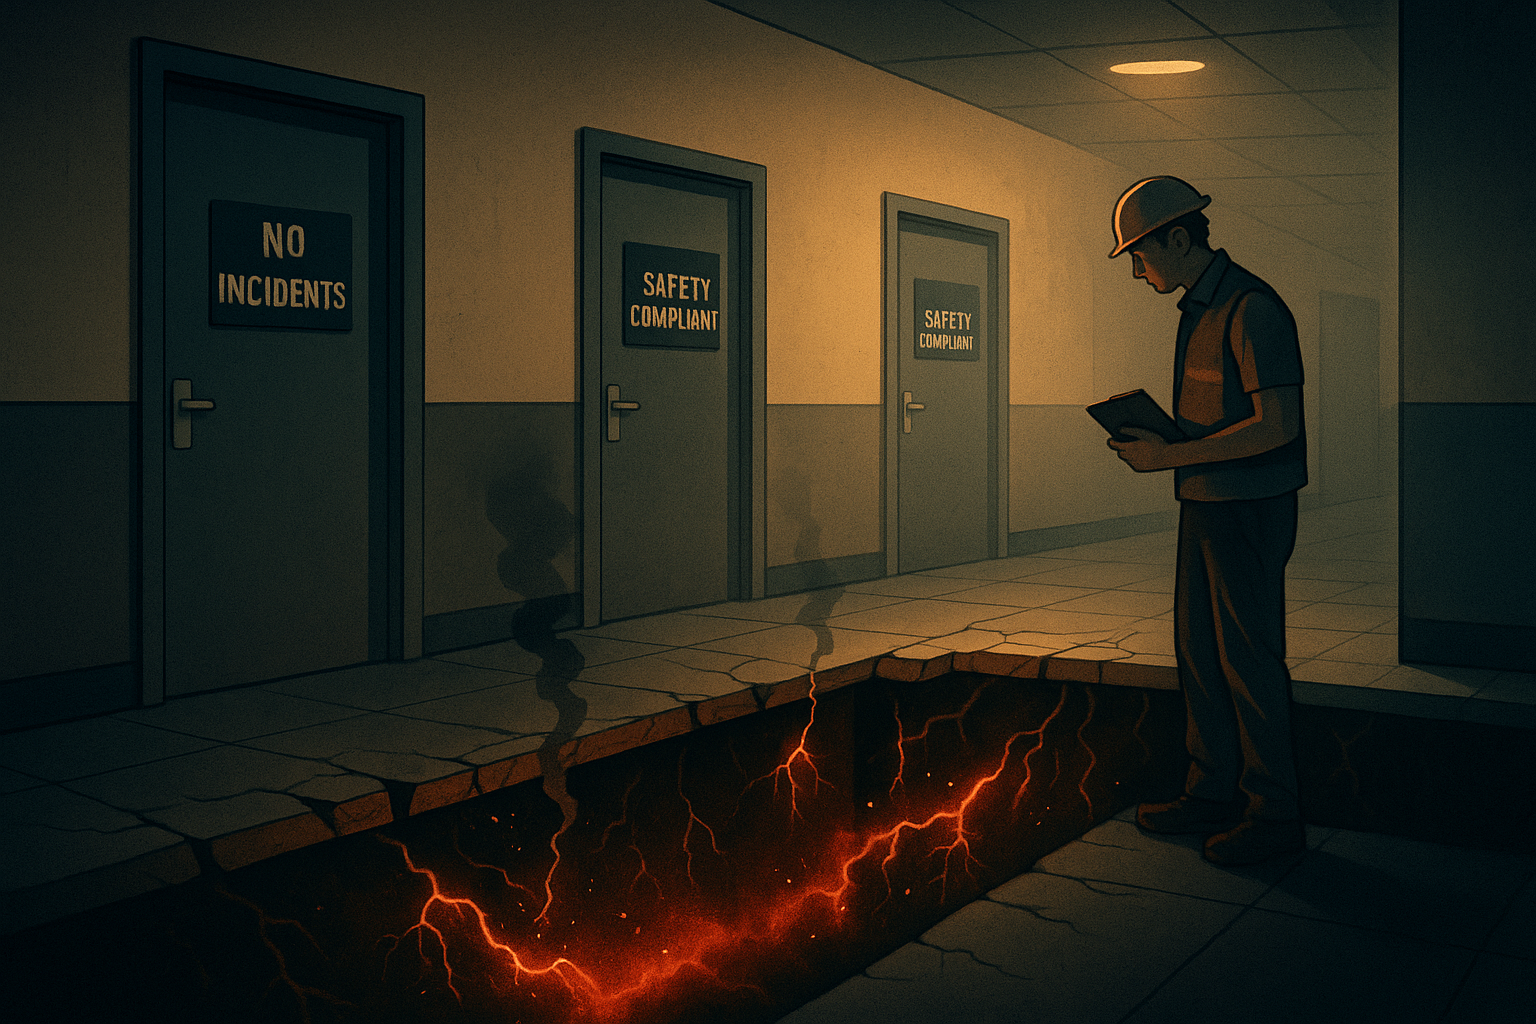
A clean safety record that hides systemic risk.
This article is about what happens when safety becomes a scoreboard. When the numbers we report become more important than the stories behind them. When fear of failure overshadows opportunities to learn. When the appearance of safety masks a culture of silence.
It’s a warning. And it’s also a blueprint—for what we should be tracking instead, and how we can shift safety from performance theater back to a real commitment to protecting people.
The Problem with Lagging Indicators
Let’s start with what we typically measure in safety. Metrics like TRIR, which calculates OSHA-recordable injuries per 100 full-time employees; DART, which includes incidents resulting in job transfer or restricted duty; and LTIR, which counts injuries that lead to lost workdays. These are known as lagging indicators. They track what’s already happened. They measure outcomes, not the causes.
And while they’re useful for establishing long-term trends, they don’t tell you what’s coming. Worse, in many organizations, these metrics become distorted. In environments where safety numbers are tied to leadership incentives, contract eligibility, or corporate reputation, data is often manipulated. Injuries go unreported. First aid incidents are brushed off. Entire categories of risk become invisible—not because they don’t exist, but because they’re inconvenient.
Consider the 2005 BP Texas City Refinery explosion. That site had excellent TRIR numbers leading up to the incident. But the facility was teetering under the weight of deferred maintenance, poor communication, and systemic risk. Fifteen people died. More than 180 were injured. The numbers told one story. Reality told another.
What Happens When Safety Becomes a Scoreboard
Picture this. A worker sustains a minor injury but doesn’t want to be the one to end the “record streak.” A supervisor encourages a band-aid solution—literally and figuratively—so it doesn’t escalate into a reportable event. A near miss occurs, but no one logs it. People whisper about it on break but never put it into the system. Everyone knows what happened, but no one wants to be blamed.
Now multiply that across a company with 2,000 employees.
When safety becomes a performance metric instead of a value system, the wrong incentives are created. Safety becomes something to “get through,” not something to live. And eventually, something critical gets missed.
The consequence isn’t just bad data. It’s broken trust. When workers stop believing that their voice matters, or that safety reporting is welcomed, the silence becomes dangerous.
Why the Pressure to Look Good Is a Hidden Hazard
Too many companies directly tie safety performance to bonuses, contract renewals, or audit scores. That creates immense pressure to maintain a spotless record—on paper.
EHS leaders feel it. Supervisors feel it. Workers feel it most of all. They know that raising a red flag can mean more paperwork, a slower shift, or even being labeled a troublemaker. In one logistics firm, a site manager altered the classification of 12 injuries after the fact, just to avoid reaching a regulatory threshold. When the truth came out, the damage to the company’s reputation far exceeded the cost of the citations.
When organizations prioritize looking safe over being safe, everyone loses.
What You Should Be Measuring Instead
If lagging indicators tell us what happened, leading indicators tell us what might happen next. They shine a light on behaviors, system health, and cultural engagement.
Start with near-miss reporting. The frequency of near-miss reports is one of the best predictors of future risk. The act of reporting signals trust, not because the events are dangerous. When near misses are routinely submitted, reviewed, and discussed, it means workers feel safe telling the truth.
Next, examine how many corrective actions are implemented and followed through. If your team identifies risks during audits or investigations, but those risks remain unresolved, you’re not improving—you’re documenting failure.
Take a look at training. Not just whether it’s completed, but whether it’s retained. Are workers competent and confident in what they’ve been taught? Are they applying it on the floor or just clicking through modules?
Then explore inspection trends. Are your safety inspections identifying meaningful issues? Are they leading to change? Or are they just compliance exercises with boxes ticked?
Finally, pay attention to the quality of safety conversations. Are supervisors and team leads talking about safety daily? Or is safety only mentioned when something goes wrong?
These aren’t abstract ideas. They’re measurable, actionable insights that reveal the strength—or weakness—of your culture.
Near Misses: The Canary in the Coal Mine
The aviation industry has mastered the use of near-miss data. Pilots and air traffic controllers regularly submit anonymous, non-punitive reports of close calls. These systems have helped reduce mid-air collisions and drive continual improvement—even as air traffic increases.
Other industries are slowly catching up. In manufacturing and construction, for example, forward-thinking companies are now incentivizing near-miss reporting and celebrating “almosts” that didn’t become accidents.
When near miss reports are considered wins—not red flags—something powerful happens. People start participating. Problems emerge earlier. Corrections are made faster. And real safety emerges—not just on paper, but in behavior.
From Compliance to Culture
True safety leadership means creating an environment where people care enough to speak up—and are supported when they do.
If your safety metrics solely indicate the lack of injuries, you are managing in the past. You’re solving problems after they hurt someone.
Instead, ask yourself, do our numbers reflect engagement or just absence of failure? Are we measuring learning? Are we capturing early warning signs? Are we seeing trust in action?
If the answer is no, it’s time to rethink what success looks like.
How sam® by secova Helps You See What Others Miss
sam® is built not just for compliance—but for clarity.
The platform encourages quick, easy reporting from any device. That means more near misses logged, more hazards identified, and more insights gained—without slowing down the work.
CAPAs are tracked through to resolution, ensuring issues aren’t just flagged—they’re fixed. Training data integrates with incident history, giving a full view of where your gaps actually are. And with transparent dashboards, everyone from the front line to the C-suite can see not just what happened—but what’s changing.
The result isn’t just fewer injuries. It’s more truth. More learning. And more lives protected.
The Final Word: What Safety Metrics Should Really Mean
Zero injuries should never mean zero conversation.
When the numbers are perfect, ask harder questions. When the reports are blank, look closer. When people are quiet, listen louder.
Real safety isn’t quiet. It’s collaborative. It’s ongoing. And it’s never just about checking the box.
If your dashboard fails to reflect your culture’s pulse, it’s time to revamp it.
Let sam® by secova help you measure what truly matters—before the silence becomes the signal.
Recent Blogs
-
Jerry Quandt 13 Jun, 2025
More Than a Moment: How to Make Safety Culture Part of Everyday Work
-
Jerry Quandt 30 May, 2025
Beyond The Tags
-
Jerry Quandt 14 May, 2025
The Top 10 OSHA-Required Trainings: Are You Truly Compliant?
-
Jerry Quandt 05 May, 2025
The Hidden Danger of Safety Metrics
-
Jerry Quandt 28 Apr, 2025
The Rise of the Safety Champion: